
Doppler Waveforms: A Visual Guide
Published
Start With the Trace, Not the Diagnosis
A spectral Doppler waveform plots velocity (vertical axis) against time (horizontal axis). It shows how sampled blood moves relative to the transducer during each cardiac cycle, not a direct picture of a vessel. Before naming a pattern, identify the vessel and sample location, verify the scale and baseline, and ask whether the acquisition is technically sound. This educational guide is for SPI and vascular exam study; interpretation in patients depends on the complete examination and local validated criteria.
Read this beside /blog/spi-physics-concepts-ardms-exam for the physics foundation and /blog/vascular-technology-registry-rvt-prep for the broader RVT study plan.
How to Read a Spectral Doppler Display
The baseline marks zero Doppler shift. Above it usually means flow toward the probe and below it flow away, but the operator can invert the display: color or screen position alone cannot establish anatomic direction. The outer envelope is the fastest detected component at a given instant; the darker interior contains other velocities within the sample volume. Peak systolic velocity (PSV) is the envelope's systolic maximum, and end-diastolic velocity (EDV) is measured just before the next upstroke. Machine velocity labels depend on correct angle correction.
Use a small sample gate positioned in the vessel lumen and align the angle cursor with the actual flow direction, not merely the vessel wall. For velocity measurements, laboratories commonly keep the Doppler angle at or below 60 degrees: angle error rises sharply near 90 degrees because the Doppler shift depends on the cosine of the insonation angle. Ask for a longitudinal view and avoid measuring at a bend or turbulent jet unless that is the intended site.
Three Shapes to Recognize
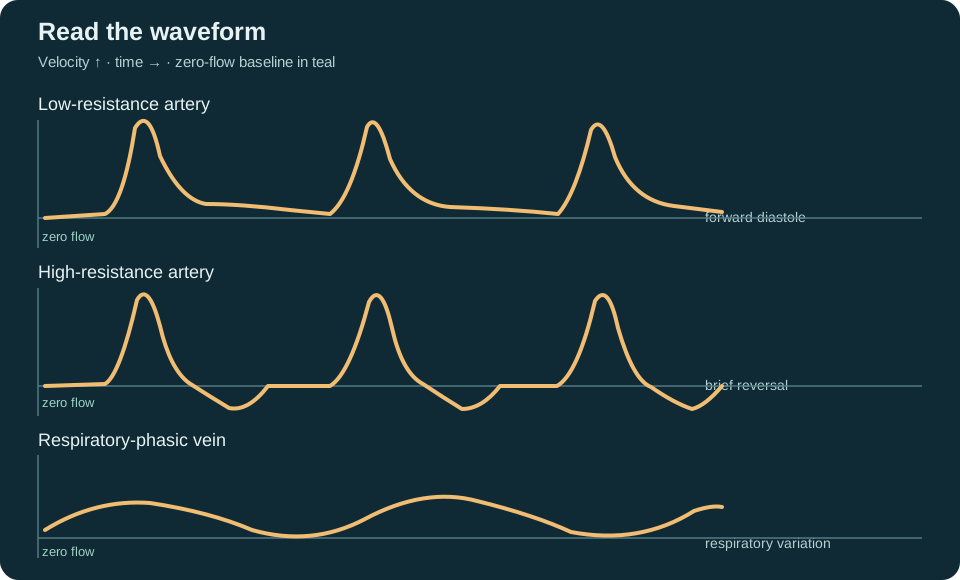
Low-resistance artery. A brisk systolic upstroke followed by sustained forward diastolic flow indicates relatively low downstream impedance. Internal carotid and renal parenchymal arteries commonly show this pattern. It does not by itself prove a vessel is normal; compare with the rest of the examination.
High-resistance artery. A sharp systolic peak with little forward flow in diastole, sometimes including a short early-diastolic reversal, reflects higher downstream resistance. A normal resting peripheral muscular artery can be triphasic. Count phases by crossing and recrossing the baseline, not by counting peaks above it; exercise, temperature, and distal vasodilation can change the pattern.
Venous flow. Venous spectra are generally lower velocity and vary with respiration. Lower-extremity venous flow normally changes with breathing, but waveform appearance depends on the sampling site. Continuous flow where respiratory phasicity is expected can prompt evaluation for a more proximal obstruction; absence of phasicity alone is not a diagnosis. Compression, anatomy, and clinical context remain central to DVT assessment.
Follow the Waveform From Normal to Abnormal
At a focal arterial narrowing, velocity may rise as the flow channel constricts, with spectral broadening and disturbed flow near and beyond the lesion. Distally, a damped, delayed systolic rise (tardus-parvus) can point toward a proximal hemodynamically important lesion. But scale, sample placement, cardiac output, and diffuse disease can alter velocities. Grading stenosis requires vessel-specific, lab-validated criteria and comparison with nearby segments rather than an isolated number.
The resistive index is (PSV − EDV) / PSV. It summarizes the relationship between systolic and diastolic velocities; it is not a direct measurement of vascular resistance. High or low values depend on the organ, patient physiology, and measurement technique. Do not transfer a renal threshold to a fetal or carotid vessel.
Aliasing, Broadening, and Other Traps
Pulsed-wave Doppler samples at a defined depth but cannot unambiguously display shifts above the Nyquist limit (half the pulse repetition frequency). Aliasing wraps the spectral envelope to the opposite side of the baseline; it does not prove flow truly reversed. Raise the scale/PRF, shift the baseline for display, use a lower transmit frequency, or use a shallower sample if appropriate. Continuous-wave Doppler can capture high velocities without pulsed-wave aliasing, but loses precise depth localization.
Spectral broadening is not automatically disease. An oversized gate sampling the vessel wall, a sample near a branch, excess gain, or a steep angle can fill in the spectral window. First optimize gain, gate size, and angle; then repeat at the intended segment and compare proximal and distal spectra. For artifact recognition, see /blog/ultrasound-artifacts-visual-guide and /blog/ultrasound-knobology-image-optimization.
Exam Tip: When a stem asks whether a spectrum indicates reversal, check both the baseline and the display inversion setting. When it asks for a measured velocity, check angle correction and scale before applying any diagnostic threshold.
A Practical Board-Question Sequence
First, name the modality (color, pulsed spectral, or continuous-wave). Second, identify what was sampled and whether the angle and gate are credible. Third, describe systole, diastole, direction, and phasicity without attaching a diagnosis. Fourth, compare with expected physiology for that vessel and with adjacent segments. Finally, apply only the criteria specified for that vascular bed and laboratory. Drill the sequence with /specialty/spi and /specialty/vt.
Frequently Asked Questions
Q: Does a waveform below the baseline always mean abnormal flow?
No. It indicates motion away from the probe under the current display convention. Probe orientation or display inversion can put normal flow below the baseline.
Q: Is a triphasic waveform always required in a healthy limb?
No. Peripheral waveforms vary with temperature, exercise, age, and vascular bed. A changed waveform should be interpreted with its site and the complete study, not as a stand-alone diagnosis.
Q: What is the difference between aliasing and real flow reversal?
Aliasing is a display ambiguity when the Doppler shift exceeds the pulsed-wave sampling limit. True reversal remains after appropriate scale adjustment and corresponds to flow in the opposite direction.
Q: Why does a 60-degree angle matter?
The Doppler equation uses the cosine of the angle. Small cursor errors at steep angles create increasingly large velocity errors, so measured velocities need careful alignment and a documented, reproducible technique.
Takeaway
A reliable reading starts with a trustworthy acquisition, then describes flow shape and timing before reaching for a diagnosis. Practice translating envelope, baseline, diastole, and phasicity into physiology; use vessel-specific criteria only after checking the technique. Continue with /specialty/vt or the SPI guide at /blog/ardms-spi-exam-complete-guide.
Sources & Further Reading
- Sonography Principles and Instrumentation examination — Inteleos / ARDMS
- Registered Vascular Technologist certification and examination — Inteleos / ARDMS
- Carotid Artery Stenosis: Gray-Scale and Doppler US Diagnosis (SRU consensus) — Radiology / SRU
- Professional Performance Guidelines — Society for Vascular Ultrasound
If you find this article helpful and want to put the strategies into practice, sign up for an Ultrasound Analytics account to access the full ARDMS-aligned question bank, AI tutoring on every missed answer, full-length timed exams, and the analytics dashboard that translates your performance into a Readiness Score for each specialty registration.